Every event gets one Report page with five tabs — Overview, Audience, Questions & Topics, Content follow-up, Reactions. It is the same page during and after the event: while the event is live it is a dashboard whose numbers move; when the event ends it becomes the labelled final report and stays available indefinitely.
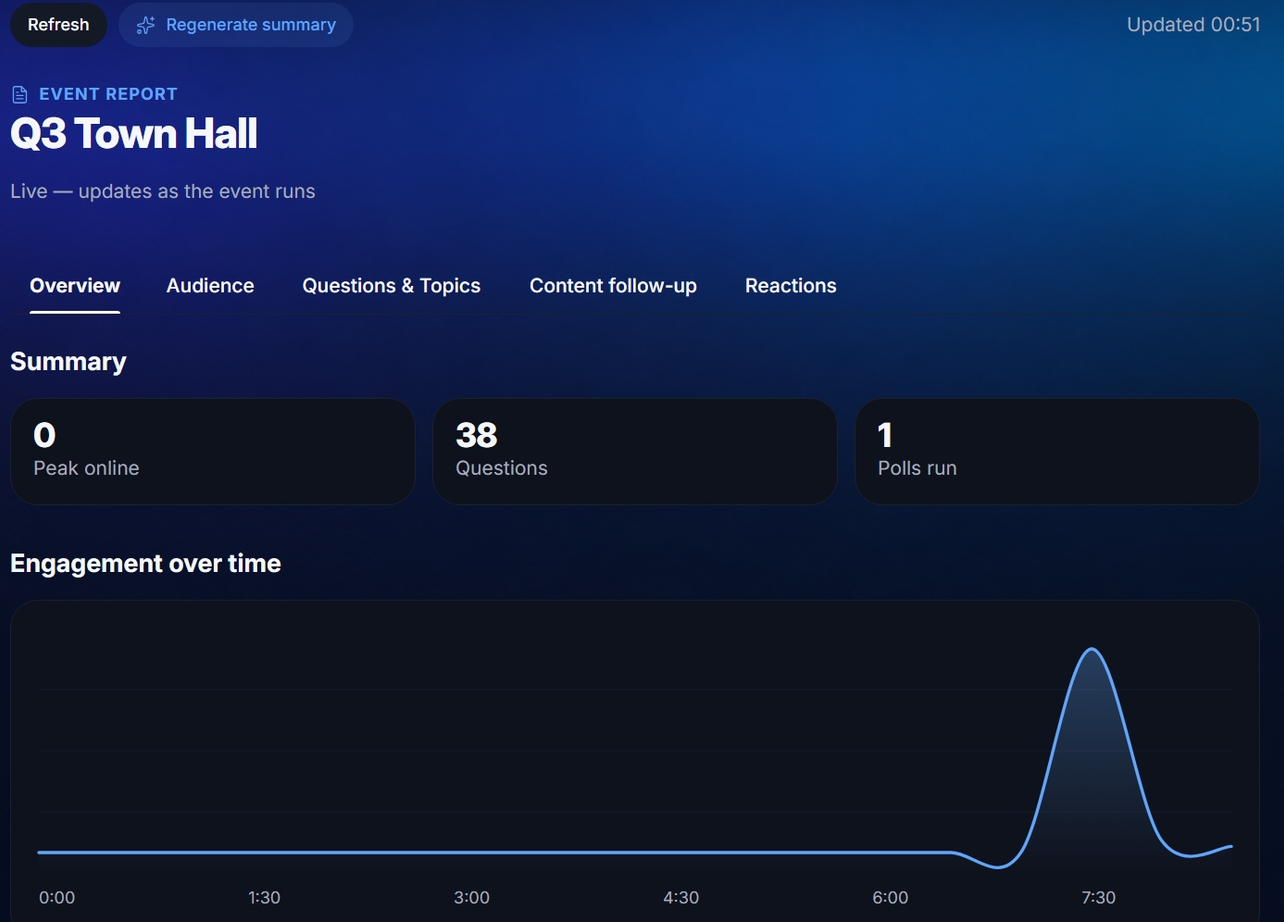
Overview
The summary tiles — peak online, questions, polls run, reactions, average rating — then engagement over time, the AI-synthesised key takeaways, and highlights: the moments worth knowing about (the peak, the most-voted question, the sentiment high point), each tagged with where it came from.
Audience
The attendance curve, when the peak happened, and how the room filled and emptied. Attendance sampling starts when the event goes live, so a scheduled event shows nothing here yet.
Questions & Topics
How many questions were asked and answered, the answered rate and average reply time, the top questions by votes, and the topics the room kept returning to.
Content follow-up
The things to send after the event: questions that went unanswered, requests for slides and recordings, promises made from the stage. Poll results and their vote counts are here too, and every update that was sent with how many people were online when it went out.
Reactions
The reactions timeline, the peak reactions-per-minute and the per-emoji breakdown. (On some deployments only the total timeline is available; the tab says so.)
The three kinds of numbers
To know how much to trust each figure, it helps to know that they come from three different kinds of source.
Counted from the record — exact
Every question, answer, comment, poll, vote, rating and update is stored the moment it happens. When you open the Report those numbers are re-counted from that record on the spot, never copied. A consequence: they can legitimately keep improving after the event — if a moderator answers a leftover question the next morning, the answered count updates.
Sampled while live — the pulse
Two things have no permanent record of their own: how many people are online right now, and the running reaction total. While the event is live the report engine walks past every minute or two and writes down the reading. The engine visits more often when the event is busy and less when it is quiet, and if a reading cannot be taken it skips the sample rather than writing a zero — a missing dot is honest; a fake dip is not.
Written by AI — the synthesis
The key takeaways and the summary are synthesised from the questions and chat — themes judged on merit, not volume. They are labelled AI-synthesised wherever they appear. Regenerate summary asks for a fresh one; otherwise the stored summary is shown.
Live vs final
Events do not end on a clock edge — questions trickle in after the scheduled finish. The Report keeps reading during that overtime and freezes only once the room has genuinely gone quiet, so the last-minute burst is not lost. The frozen report is the permanent artefact; the header reads Ended with the date and time.