Insights breaks the event down while it runs — participants, the live summary, what the Event AI has been asked, sentiment, reactions and clips. Report is the same story as a document you can send on; Insights is the live version. Most panels update on their own; Refresh forces a re-read.
Participants
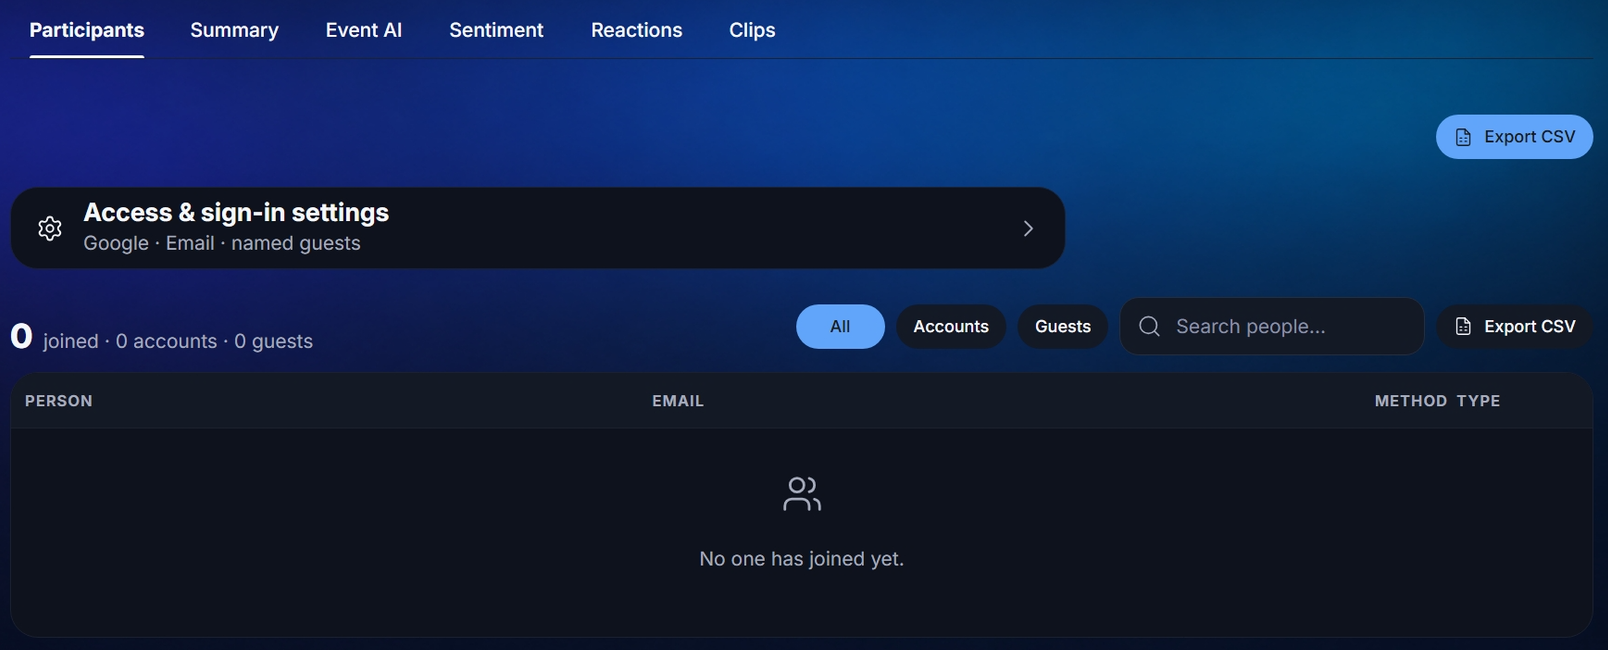
Who can join and who has joined: Access & sign-in settings summarises the sign-in and guest settings in force (and opens them), then the people who joined with an account, with their name and email. Guests are not listed here. Search people… filters the list; Export CSV downloads it — the place to start for a data-access request.
Summary
The Event Summary and Key Takeaways: the agents' read of the room, rewritten as the room moves — at most a few bullets of the themes actually being raised, judged on merit rather than volume. The header says when it was last written; each new synthesis replaces the whole set. Once the event ends the summary is marked Final — frozen at conclusion.
Event AI
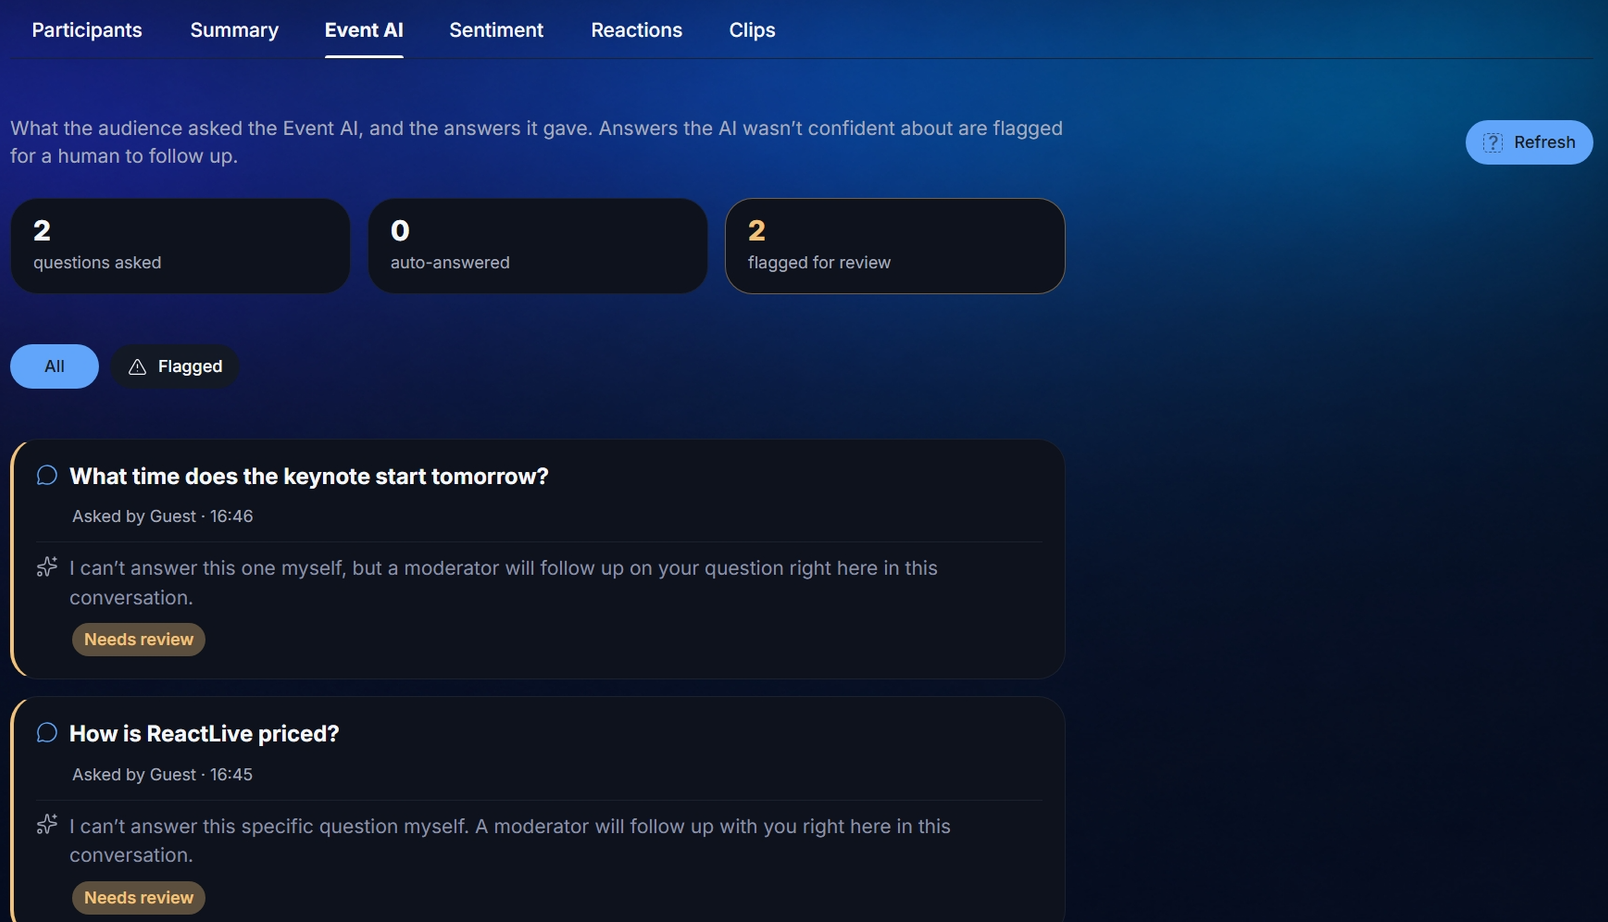
What the audience asked the Event AI in private, and the answers it gave. Three counts at the top — questions asked, auto-answered, flagged for review — and a list of every exchange. Answers the AI was not confident about are Flagged for a person to follow up: the attendee has already been told a moderator will follow up in the conversation, so open it and reply there.
Sentiment
How the Q&A and chat feel, read every couple of minutes from what people actually typed. The tab shows the positive share now and the sample size it was read from, with a sentence explaining the read, the split between positive, neutral and negative, and Sentiment over time, the positive share per window.
It is honest about thin data. With fewer than a handful of contributions in a window it says not enough signal yet instead of showing a percentage computed from two comments. And it deliberately keeps sentiment (only the people who typed something) separate from engagement (the whole room).
Reactions
Every reaction the audience app sends, totalled and broken down per emoji, with the peak reactions-per-minute. If the event has reactions off, the tab says so.
Clips
Shareable highlight clips from the event's key moments — the spikes in the engagement curve — appear here as the event unfolds.